import numpy as np
import pandas as pd
import statsmodels.api as sm
#import sklearn
from sklearn.datasets import load_diabetes
from sklearn.linear_model import LinearRegression
from sklearn.model_selection import cross_val_predict
from sklearn.metrics import PredictionErrorDisplay

import matplotlib.pyplot as plt
import seaborn as sns
sns.set()Sample Data Science project
first we import all we need
Loading the data
Just loaging some stock data from scikit-learn and making some plots.
X, y = load_diabetes(return_X_y=True)
lr = LinearRegression()
y_pred = cross_val_predict(lr, X, y, cv=10)
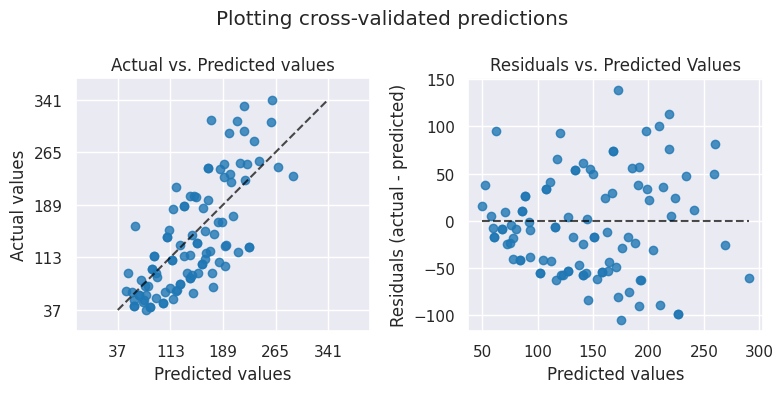
fig, axs = plt.subplots(ncols=2, figsize=(8, 4))
PredictionErrorDisplay.from_predictions(
y,
y_pred=y_pred,
kind="actual_vs_predicted",
subsample=100,
ax=axs[0],
random_state=0,
)
axs[0].set_title("Actual vs. Predicted values")
PredictionErrorDisplay.from_predictions(
y,
y_pred=y_pred,
kind="residual_vs_predicted",
subsample=100,
ax=axs[1],
random_state=0,
)
axs[1].set_title("Residuals vs. Predicted Values")
fig.suptitle("Plotting cross-validated predictions")
plt.tight_layout()
plt.show()